Prices move in cycles, yet demand in central London keeps defying the dip. You’ll notice Westminster and the City delivering resilience, footfall, and premium rents, while places like Camden and Shoreditch attract creative and tech tenants with vibrant ecosystems. Connectivity, regeneration, and flexible tenancy terms shape outcomes for 2025, but the real test is how you balance cost with long-term stability as market cycles pivot again. Ready to weigh which borough fits your sector and strategy.
How to Pick the Right London Borough for 2025 Leases

Choosing the right London borough hinges on current demand signals, rental trends, and the sector mix that matches your business needs. You’ll assess supply constraints, vacancy rates, and price trajectories across zones, then map them to your operational requirements and growth plan.
Historical trends reveal where capex has concentrated and where absorption has outpaced delivery, signaling resilience during cyclical downturns. Demographic shifts matter: anticipate footfall, commuter patterns, and nearby talent pools that align with your service or product.
Compare cluster performance—retail, tech, and professional services—to judge where concentration supports visibility and cross-collaboration. Don’t ignore macro constraints like planning approvals and transit upgrades; they reshape long-run demand.
Choose a borough whose trajectory mirrors your risk tolerance and expansion timetable.
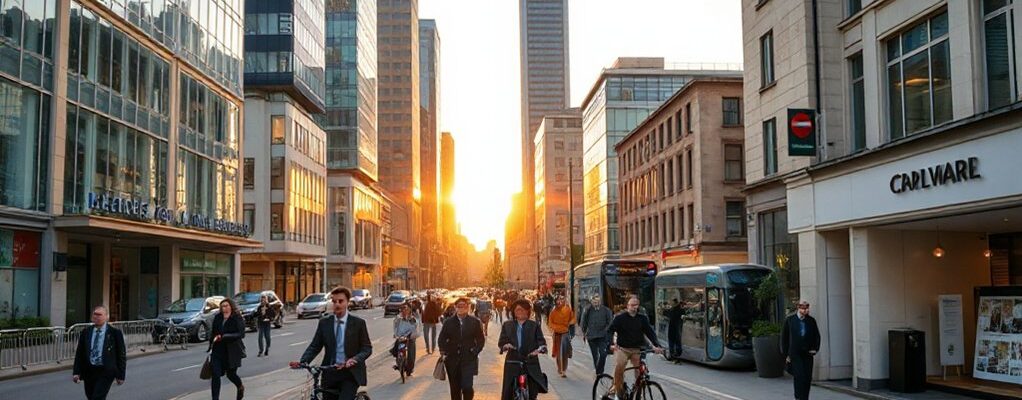
Central Hubs for Footfall and Visibility
In 2025, occupancy payback favors transit-adjacent sites and mixed-use quarters that balance office occupancy with daytime retail draw. Data show that pedestrian densities rebound fastest near interchange hubs and cultural landmarks, reinforcing cyclical demand tied to seasonality and school terms.
Green spaces act as spillover magnets, extending dwell time and pedestrian networks. Strategic leases should weight accessibility, ancillary amenities, and footfall multiplexing, ensuring resilience when markets tighten.
Consider how surrounding cultural landmarks augment brand resonance and duration of stays.
Westminster, City, and the Core Loop: Pros and Cons
Westminster and the City offer high footfall, premium occupier demand, and resilient rents. However, you’ll feel its cycle-driven sensitivity to policy shifts and leasing velocity.
The Core Loop shows tight supply and accelerating take-up in moments of market tightness, even as tenant migration and price dispersion signal evolving tradeoffs.
You’ll want to weigh premium location value against construction pipelines, timing risk, and the potential for slower post-peak absorption as cycles turn.
Westminster Advantage And Drawbacks
The Westminster-City-Core Loop offers dense demand and liquidity, but its advantages come with notable trade-offs. You’ll see elevated rents and competition, driven by international firms and government-linked tenants tapping on short notice, with leasing cycles tightening during policy reviews and fiscal events.
Accessibility is unmatched, yet congestion and required security add operating frictions, increasing occupancy costs.
Cultural landmarks and Historical districts attract brand-conscious tenants seeking prestige, boosting premium space demand but narrowing supply in core pockets.
You’ll benefit from robust resale or renewal options when market sentiment improves, yet economic softness can compress yields and prolong vacancy in submarkets reliant on public-sector budgets.
Core Loop Dynamics And Tradeoffs
Core Loop dynamics in Westminster, City, and the Core Loop hinge on tight rent resilience, rapid tenant churn, and policy-driven cycles that shape timing and risk. You observe how vacancy rattles prices during downturns, then rebound as demand returns near office-using sectors.
The loop favors locations with dense transport, amenity clusters, and predictable renewal pipelines. Urban renewal efforts recalibrate space Class A density, driving upgrading upgrades and incremental rents when occupiers pursue prestige spaces.
Sustainability initiatives influence tenant fit-out costs and long-term operating schedules, subtly shifting capex vs. opex preferences. You’ll notice the strongest loops link asset turnover to public incentives and planning approvals, compressing or expanding break-even horizons.
In this ecosystem, careful forecasting of policy shifts and market tempo reduces exposure to abrupt corrections.
Up-and-Coming Boroughs to Watch in 2025
New growth trajectories are emerging as investors and occupiers recalibrate risk and opportunity in London’s suburban-focused skyline. The 2025 outlook highlights a handful of boroughs poised to outperform as tech, flex space, and logistics demand converge with transport upgrades.
You’ll see a data-driven pull toward areas delivering mixed-use amenity, faster planning horizons, and resilient occupancy metrics. In the up-and-coming cohort, performance hinges on occupancy density, lease depth, and capex agility, not just headline rents.
Expect Cultural districts to anchor evenings and after-hours demand, while Green spaces support tenant wellness and retention. Markets show cyclical resilience when employment tech-adoption aligns with small-bay flex and last-mile fulfillment, signaling selective exposure across outer boroughs as the cycle matures.
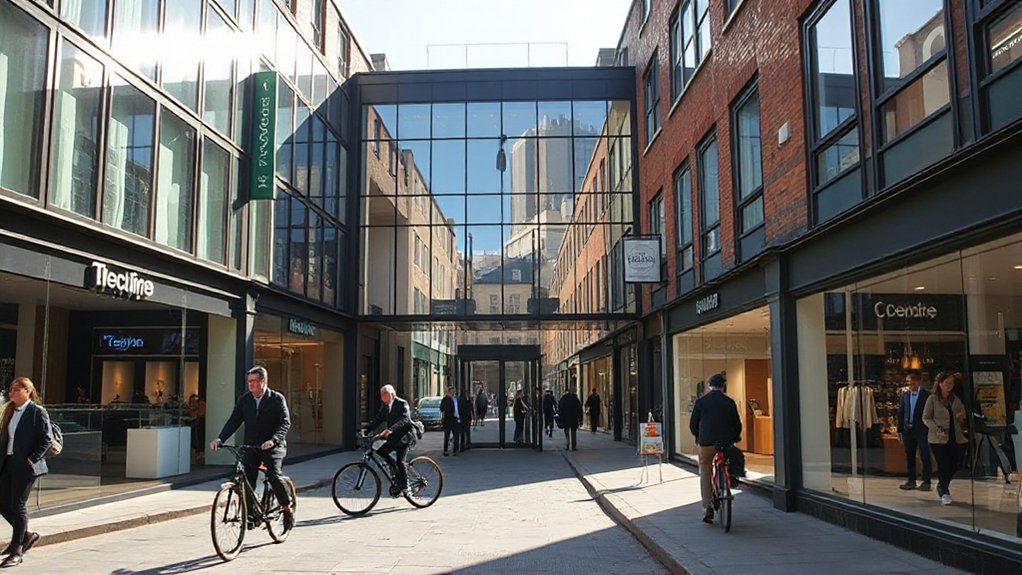
Connectivity That Counts: Transport and Last-Mile Access

In this market, Transit Proximity Impact shapes site desirability as commuters prefer quicker access to core hubs.
Last-Mile Delivery Hubs increasingly correlate with rental premiums in peak cycles, reflecting evolving fulfillment networks.
Interchange Connectivity Efficiency matters for resilience, guiding tenants to locations that sustain throughput across demand waves.
Transit Proximity Impact
Transit proximity is a decisive differentiator for 2025 London commercial leases: properties within walking reach of rail stations, major bus corridors, and emerging Crossrail/Elizabeth Line hubs consistently command higher occupancy and shorter vacancy spells.
Locations with limited last-mile access see slower rental growth. You’ll notice demand clustering around transit-rich nodes, with pricing signals aligning to access quality and service frequency.
Historical data show cyclical peaks tied to post-pandemic commuter normalization and Crossrail completions, followed by consolidation as occupier mix shifts toward flexible-space tenants.
Cultural diversity at arterial corridors correlates with amenity spillovers, boosting footfall and tenant mix resilience during downturns.
Last-Mile Delivery Hubs
Market data show parcel volumes tracking growth alongside e-commerce penetration, pressuring both site selection and cadence of re-leasing. In practical terms, hubs near transit nodes and dense neighborhoods cut dwell times and boost throughputs, with cycles of tightening supply followed by incremental rent gains.
Consider how green spaces factor into zoning debates, shaping environmental constraints and community acceptance for industrial-adjacent sites. Overall, last-mile access remains a leading differentiator in borough-level occupier strategies.
Interchange Connectivity Efficiency
Data indicates peak-hour interchange stability correlates with higher occupancy and shorter dwell times for deliveries, while disruption risk declines when pedestrian and cycling links are well integrated.
Market signals show cultural diversity around stations boosts footfall variety and catchment breadth, supporting resilient leasing values through downturns.
In this cycle, planners optimize bus-to-rail handoffs and last-mile micro-hubs, improving throughput and service levels. Expect continuous recalibration as infrastructure projects mature, preserving competitive advantage for properties anchored by superior interchange connectivity.
Office Ecosystems: Flexible Spaces and Tenancy Terms
Flexible spaces and tenancy terms are reshaping how London offices fit into corporate calendars, with demand tilting toward adaptable layouts, short commitments, and scalable occupies that ride with market cycles. You’ll see coworking-style ecosystems and hybrid-configured suites driving tenancy blends, as occupiers prioritize speed to occupancy and risk mitigation.
Data signals show vacancy-rate dips when flexible leases align with quarterly planning, while renewal gaps compress during supply shifts. Market intelligence points to operators layering wellness-focused amenities and modular tech platforms to boost utilization and uptime.
Sustainability initiatives increasingly anchor lease-incentives and certification goals, making asset desirability hinge on energy performance. In this cycle, boroughs delivering rapid-fit flexes paired with verifiable ESG credentials win longer-term occupancy momentum.
Price, Value, and Long-Term Cost of Occupancy
In 2025, you’ll see total occupancy costs tilt toward a mix of headline rents, fit-out premiums, and ongoing operating charges. Long‑term affordability will be driven by energy performance, maintenance cadence, and flexibility provisions.
Across boroughs, price signals reflect cyclical demand, with premium pockets where luxury amenities and locational advantages justify higher upfronts. Value emerges from the total cost of occupancy, not the sticker price, as energy efficiency lowers operating spend and service-level expectations shape maintenance cadence.
Lease negotiation increasingly rewards long‑term occupancy with staged capex, with escalation disciplined by market cycles. For tenants, choosing a property with strong energy ratings and adaptable layouts mitigates risk during downturns.
In volatile periods, data‑driven benchmarking clarifies margins between premium locations and sustainable, predictable occupancy costs.
Sector Fit by Borough: Retail, Tech, Creative, Professional Services
Across London’s boroughs, sector-specific footprints diverge by demand cycles: retail clusters flourish where footfall and experiential amenities align with consumer flows, tech hubs concentrate where talent and scale economies converge, creative spaces thrive in mixed-use fabric with adaptable layouts, and professional services cluster where transport links and prestige anchor client access.
In 2025, you’ll find Retail strongest near transit-rich town centres with improved experiential offerings, while Tech concentrates where university pipelines and funding ecosystems intersect, yielding higher value per square foot.
Creative occupiers favor mixed-use districts near cultural hubs, alongside flexible space controls.
Professional Services secure efficiency where commute times are predictable and reputational anchors matter.
Historical landmarks and Cultural diversity influence tenant mix, pricing, and renewal dynamics, shaping borough-seasonal demand patterns.
Regeneration and Infrastructure Shaping Future Leases
Regeneration and infrastructure projects are already reshaping lease economics and negotiation timelines across London’s boroughs. You’ll notice shorter certainty queues for planning approvals in high-growth corridors, while established districts tighten due diligence around permits, tax incentives, and capex timelines.
In market terms, infrastructure-led demand shifts compress negotiation windows as tenants chase access to upgraded transit, utilities, and digital networks. Data shows Cultural landmarks catalyzing footfall spillovers, supporting premium rents but raising vacancies where projects lag.
Local demographics drive tenant mix, with younger cohorts favoring flexible space and clustering around regeneration hubs. Cycles remain price-sensitive: initial concessions may widen, then tighten as projects near completion and occupancy rates rise.
Across boroughs, the forecast hinges on timely delivery, corridor alignment, and sustained investor confidence.
Frequently Asked Questions
How Do Lease Terms Vary by Borough for 2025?
Lease terms vary by borough in 2025, with renewals trending shorter cycles in central zones and longer in outer districts. You’ll see rising rents, selective tenant improvement incentives, and renewal rates influenced by cyclical demand and market data.
Which Borough Offers the Best Mix of Rent and Footfall?
You’ll find Croydon offers the best mix of rent and footfall, driven by robust retail clusters and dense office hubs, with cyclical resilience and data-driven demand signals guiding occupier choices across those clusters.
What Incentives Commonly Accompany 2025 Commercial Leases?
Echoes of market trends guide you: leases commonly offer tenant incentives like rent-free periods, fit-out contributions, and stepped rents, aligning with cyclical demand, while you assess cost-saving opportunities in evolving market trends to optimize occupancy.
How Do Submarket Dynamics Impact Occupancy Risk?
Submarket dynamics heighten occupancy risk as market volatility fluctuates demand. You experience shorter tenancies during downturns and longer leases when confidence returns, so tenant stability hinges on timing, lease terms, and adaptive space strategies in cyclical markets.
Which Boroughs Balance Long-Term Value With Regeneration Risk?
In a hypothetical case, you’d target boroughs where neighborhood gentrification is paired with infrastructure investment, balancing long-term value and regeneration risk as cycles shift; Greenwich-like areas benefit from upsides amid steady occupancy, supported by data-driven policy.
Conclusion
You should lean into data-driven signals: footprint, footfall, and regeneration cycles point to Westminster, City, and core Loop as durable bets, with Camden and Shoreditch offering resilience for creative and tech tenants. Track transport upgrades, rent trajectories, and tenancy mix shifts—these cycle with business confidence and consumer demand. Think of the market as a tide you ride, not a wall to break through—a rising sea that steadies your occupancy through 2025 and beyond.