
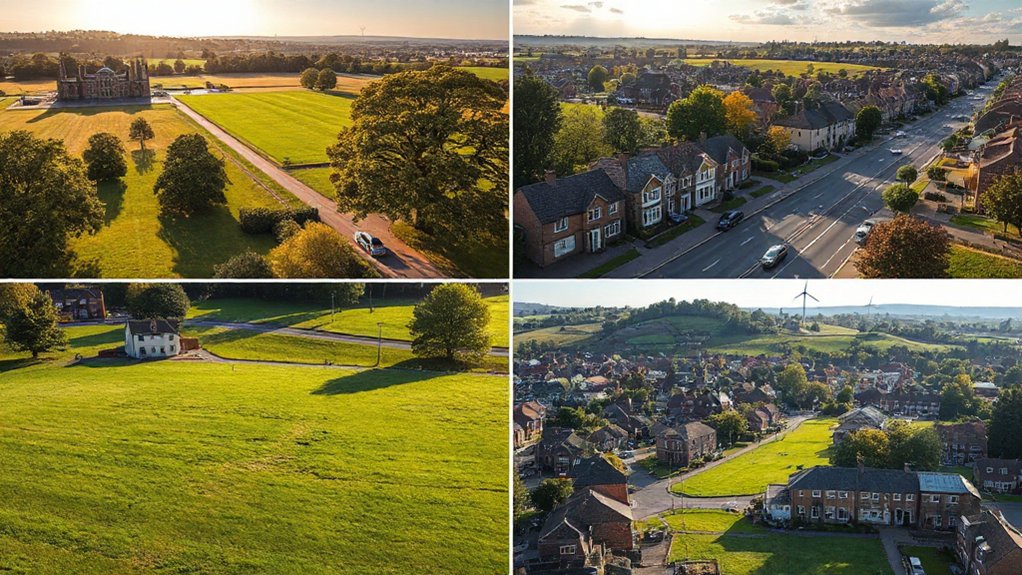
Nottingham offers a mix of growth potential, steady demand, and solid yields across pockets like the city center, university corridor, and reliable suburbs such as Beeston and Wollaton. Each area carries different risk profiles, affordability ceilings, and regeneration momentum. You’ll want to weigh connectivity, rents versus buy-in, and upcoming schemes before committing. There’s more beneath the surface that can alter cash flow and long-term resilience. Let’s explore what matters most for your strategy.
Nottingham Investment Framework: Yield, Growth, and Risk

The Nottingham investment framework combines yield, growth potential, and risk into a clear, data-driven view of opportunity. You assess cash-on-cash returns, cap rates, and occupancy trends to quantify yield.
Growth emerges from population inflows, university spillovers, and redevelopment plans that lift rental demand and asset values.
Risk is framed by vacancy resilience, regulatory changes, and macro volatility, so you stress-test scenarios and set safety margins.
You’ll integrate historical data, price trajectories, and rental benchmarks to forecast cash flow stability across districts.
Historical landmarks inform nostalgic value but don’t drive core yield; the culinary scene signals amenity demand and street-level footfall that correlate with rent potential.
In practice, you compare assets to a quantified risk-adjusted hurdle rate, selecting opportunities with durable, data-supported upside.
Best Growth Areas in Nottingham: Citywide Overview
Nottingham’s growth story centers on neighborhoods where population inflows, university spillovers, and redevelopment plans lift rental demand and asset values. Across the city, growth hotspots are identified by housing turnover, vacancy trends, and infrastructure momentum, not hype.
You’ll see stronger rental growth in mixed-use districts with redeveloped cores, supported by improving transport links and amenity upgrades. Risk is concentrated where planning timelines slip or affordability constrains demand, so you should monitor delivery risk and wage growth alongside vacancy statistics.
Historical architecture provides value anchors, signaling heritage credibility while upgrades unleash modern productivity. Local cuisine clusters contribute to daytime-footfall resilience, complementing office and retail demand.
Citywide, diversification across micro-markets mitigates risk, yet capital allocation should favor areas with scalable infrastructure, clear rezoning, and measurable performance indicators.
The University Corridor: Renters Magnet and Yields
Across the University Corridor, renters flock to proximity to campuses, key amenities, and rapid transport links, driving stable demand and compressing yields in core blocks.
You’ll find student housing demand concentrated around Nottingham Trent and University of Nottingham sites, translating into tighter vacancy margins and resilient rent growth, even when macro conditions soften.
Cap rates hover close to city benchmarks, but risk rises where dormitory supply outpaces absorption, or where commuting options shift.
Neighborhood gentrification pressures can elevate long-term asset values yet alter tenant mix, potentially narrowing renter pools and increasing turnover costs.
Data indicates steady occupancy in purpose-built blocks, with yield compression most pronounced near transit hubs.
You should monitor student enrollment trends, campus expansions, and zoning changes to size exposure and calibrate risk-adjusted returns.
City Centre Living: Demand and Rent Stability

City centre living shows steady demand signals, with occupancy and turnover patterns indicating resilient rental interest even amid broader market shifts.
We’ll examine current demand patterns and rent stability indicators across the centre to identify where supply constraints or seasonality influence outcomes.
Expect concise, data-driven analysis on risk factors, timing, and potential for stable yields versus volatility.
Demand Patterns In City Centre
Demand in Nottingham’s city centre remains tightly tied to fundamentals: access, amenity, and value trajectory. You’ll notice demand patterns track weekday flows, with office-led occupier shifts driving midweek occupancy and weekend variants tied to cultural hotspots.
Transport access, parking policy, and pedestrian upgrades shape willingness to commit long term, so you should expect sharper demand when delivery timelines align with evolving urban regeneration plans.
Investment risk is concentrated where residential pricing matches modal convenience and amenity access. In-city housing near theatres, museums, and dining clusters tends to show shorter absorption, yet premium rents commit to stability when cultural and dining ecosystems expand.
Keep monitoring renewal cycles and infill schemes, as these influence tenant turnover and price resilience in the near term.
Rent Stability Indicators Across Centre
Rent stability in the city centre hinges on balance between rents and demand signals, with data showing steadier occupier tenure when job access, amenities, and transport remain reliable. You’ll see rental trends track occupancy, with modest year-over-year changes in central neighbourhoods where vacancies compress during high-demand periods.
Across the centre, tenant stability improves as supply aligns with commuting patterns and service access, reducing disruption from price spikes or turnover surges. Risks emerge when employment volatility or transport reliability falters, triggering elevated vacancy risk and compressed cash flow for investors.
Our assessment emphasizes transparent pricing signals, measured rent growth, and diversified amenity access to sustain long-term occupier retention. In sum, rental trends and tenant stability hinge on consistent, predictable centre-wide accessibility and affordability.
Suburban Value: Wollaton, Beeston, Gedling
Wollaton, Beeston, and Gedling offer solid suburban value for investors and residents alike, combining strong transport links, reliable rental demand, and consistent price growth without the volatility of city-center markets.
You’ll find steadier yields than urban cores, supported by commuter access, green space, and amenities that sustain long-term occupancy. Price growth remains measured, avoiding boom-bust cycles, while vacancy risk stays manageable with growing demand from families and professionals.
Suburban charm translates to predictable upkeep costs and stable capital appreciation, not flashy spikes. Community engagement strengthens local networks, improving tenant retention and neighborhood safety.
In risk terms, diversification across these three areas cushions exposure to macro shocks, making Wollaton, Beeston, and Gedling a prudent, data-driven balance for patient investors.
Forest Fields and St Ann’s: Emerging Hubs to Watch
Forest Fields and St Ann’s are emerging hubs to watch, driven by improving transport links, growing amenity stock, and rising renter demand. You’ll see urban renewal activity aligning with updated planning guidance, supported by measurable gains in housing stock turnover and rent stability.
Investment risk is moderated by a diversified mix of affordable units and mid-market homes, plus ongoing community engagement that informs project scope and timing. Data indicate steady population inflow, with amenities expanding faster than prior cycles, enhancing livability without triggering excessive price pressure.
Proactive governance, transparent reporting, and collaboration with residents reduce uncertainty for investors. If you monitor vacancy rates, completion timelines, and quality-of-life indicators, you’ll identify countercyclical opportunities in this corridor while prioritizing sustainable development and inclusive growth.
Transport and Access: Trams, Trains, Roads
How do transport networks shape investment in Nottingham? You’ll see that tram lines, rail links, and road capacity influence property demand, development timing, and resilience to disruption.
Public transportation reliability, frequency, and coverage matter for commuting costs and vacancy risk in key districts. Trams connect city cores with suburban pockets, shaping catchment areas for offices and homes.
Rail供应, including peak-hour services and cross-country options, offers modal flexibility that broadens investor appeal and lender confidence.
Road infrastructure quality, congestion levels, and accident rates influence accessibility scoring and land values near arterial corridors. You should monitor planned upgrades, funding timelines, and compatibility with transit-oriented design.
Quality of Life and Local Amenities: Parks, Culture, Schools

You’ll weigh how Parks and Green Spaces, like the Arboretum and Wollaton Park, correlate with property values and living satisfaction.
Local Culture and Arts offerings—museums, theaters, festivals—shape daily life and community engagement, with attendance data guiding investment risk.
Schools and Education Quality, including exam outcomes and capacity, must factor into long-term desirability and resilience.
Parks And Green Spaces
Nottingham’s parks and green spaces form a core quality-of-life asset, linking residents to leisure, sport, and nature within easy reach. You’ll find a mix of public parks, riverside trails, and formal gardens that support healthy lifestyles and outdoor activity without long commutes.
Data shows green spaces correlate with higher property values and lower heat risk in summer, while access varies by ward, signaling planning priorities.
Maintenance costs and safety metrics remain key risk factors for utilization; investing in lighting, patrols, and routine upkeep helps sustain appeal.
Community gardens expand local engagement and provide low-cost food outlets, while urban forestry programs improve air quality and shade.
Prioritizing accessible routes and visible stewardship will maximize long-term liveability across Nottingham.
Local Culture And Arts
You’ll notice a dense, data-informed ecosystem: street art lines city cores, while local festivals concentrate participation in seasonal hubs.
Museums, galleries, and performance venues cluster near transport links, supporting high attendance without excessive travel.
Investment patterns favor venues with diverse programming and year-round accessibility, reducing seasonality risk.
Cultural assets anchor neighborhood branding, attracting residents who prioritise walkable access and varied leisure.
Yet, risk remains: funding cycles, venue viability, and audience fragmentation can dampen impact if not paired with inclusive outreach and targeted visibility.
Schools And Education Quality
Nottingham’s school landscape ties closely to the city’s livability and growth patterns you’ve seen in its arts and culture scene. In this section, you’ll evaluate education quality with a data-driven lens, avoiding hype.
School rankings matter for neighborhood desirability, but consider how gaps in performance correlate with funding changes and staffing availability. Local authorities allocate education funding with priorities that shift by year, affecting pupil outcomes and facility upgrades.
You should expect variance between primary and secondary results, and between urban cores and suburbs. Assess consistency across Ofsted ratings, exam performance, and access to specialist programs.
The prudent approach: map schools to housing trends, track funding cycles, and weigh safety, transport links, and after-school support when predicting long-term investment value.
How to Vet Nottingham Investment Opportunities
To vet Nottingham investment opportunities effectively, start with a clear checklist: verify cash flow projections, assess rental demand by submarket, and confirm regulatory compliance.
You’ll then stress-test returns under sensitivity scenarios, considering vacancy risk, maintenance tailwinds, and financing costs.
Analyze location fundamentals: proximity to universities, transport links, and employment hubs, plus observable trends in property cycles.
Vet asset-specific variables like condition, age, and required capex, documenting timelines and funding sources.
Scrutinize legal considerations, licensing regimes, and landlord obligations to avoid penalties.
Compare historical data on rent growth, occupancy rates, and cap rates across districts, using it to set conservative hurdle rates.
Consider qualitative signals such as Historical architecture and local cuisine to gauge desirability, while maintaining objective, data-driven decision criteria.
Buying vs Renting in Key Neighborhoods: A Practical Guide
If you’ve just finished vetting Nottingham investment opportunities, you’re now weighing a practical choice: buy or rent in key neighborhoods. In this decision, rely on current cost data, occupancy trends, and cash-flow projections.
Buying yields equity potential and predictable housing costs, but requires upfront capital, maintenance, and exposure to market swings.
Renting offers flexibility, lower entry barriers, and streamlined property management, yet you’ll face rising rents and no equity build.
Compare Rental affordability across top neighborhoods by evaluating monthly rent, utilities, and council tax against projected appreciation if you buy.
Also weigh property management needs—self-managing versus hiring pros—against the time you can commit.
Consider risk factors like tenancy turnover, vacancy rates, and local regulation, and choose the option that aligns with your liquidity, timing, and long-term goals.
Financing Nottingham Investments: Policies and Hot Markets

You should start by surveying the current financing landscape in Nottingham, including lender policies, interest rate trends, and available loan products.
We’ll highlight hot investment markets with data on yields, vacancy rates, and cap rate trajectories to frame risk-adjusted opportunities.
Finally, we’ll assess policy impacts on lending—such as affordability checks and regulatory changes—to help you gauge financing feasibility and timing.
Financing Landscape In Nottingham
Nottingham’s financing landscape combines supportive policy tools with proactive market signals, highlighting a current focus on affordable lending, rental demand, and planning-led investment.
You’ll see lenders prioritizing light-touch underwriting for build-to-rent and small-scale refurb projects, with competitive rates for energy-efficient upgrades.
Local policy nudges target steady cash flow and risk-adjusted returns, helping you align capital with demand corridors around transit and regeneration zones.
Data points show rental yields stabilizing near 5–6% in core districts, while development finance lanes favor projects with clear planning permission and community benefits.
Historical architecture and upcoming upgrades influence loan terms, rewarding preservation-focused schemes without compromising exit risk.
The culinary scene supports occupancy pace, yet market caution remains: monitor macro signals, zoning changes, and construction risk to optimize your Nottingham strategy.
Hot Investment Markets
Hot markets in Nottingham hinge on policy-led incentives, rentability, and visible regeneration momentum. You’ll see rapid value lift when planning around access to financing, development timelines, and occupancy prospects.
Data shows luxury apartments commanding higher yields in areas with phased renewal and strong transport links, though cap rates compress near standout hotspots.
Commercial properties benefit from mixed-use schemes and anchor tenants; watch for council-backed schemes that release VAT relief or GRant incentives, which can improve debt service coverage.
Regulatory continuity matters: stable lending criteria reduces re-pricing risk during cost-of-capital swings.
Diversification across districts can balance risk, but avoid over-allocating to a single trigger city quarter.
Align acquisition with measurable redevelopment milestones, occupancy projections, and transparent rent escalators for resilient returns.
Policy Impacts On Lending
Policy shifts shape lending terms and financing certainty for Nottingham investments, so you should map how macroprudential rules, regional incentives, and lender risk appetites interact with project type and location.
You’ll see that high‑value redevelopment in central pockets faces stricter affordability tests, while affordable housing signals may release concessional lending.
Lending regulations tighten on leveraged positions, boosting equity gates and stress testing for rental yields, yet regional grants can offset costs for mixed‑use schemes.
Data indicates variability by lender appetite and asset class, with commercial projects more sensitive to interest-rate cycles than residential portfolios.
Risk-aware planning requires scenario analysis: consider loan covenants, repayment horizons, and regulatory change risk.
Policy shifts redirect capital toward or away from specific neighborhoods, influencing timing and viability.
Growth Trends and Personal Living Experience
Growth trends in Nottingham show steady demand across core neighborhoods, driven by improving transport links, rising rental yields, and a growing local economy.
As an investor or resident, you’ll notice price growth outpacing regional peers in key corridors while some slower pockets offer lower entry costs. You measure momentum through data on occupancy rates, new-build completions, and yield stability, avoiding overexposure to any single sector.
In practice, lifestyle preferences influence where you live or invest, with demand clustering around mixed-use centers and amenity-rich streets. Cultural diversity supports resilient neighborhoods, driving stable demand even when macro cycles blur.
Quick-Start Plan for Newcomers to Nottingham
If you’re new to Nottingham, start with a clear snapshot of your priorities and how they map to the city’s strongest neighborhoods. You’ll benefit from a data-driven approach: compare rent yields, vacancy rates, and commute times to key districts.
Focus on early choices that hedge risk: target areas with steady regeneration, diverse amenities, and transparent planning processes. Map your goals to neighborhood profiles—historic cores for culture and architecture, modernized flats near transit for practicality, and family-friendly zones with green space for stability.
Prioritize neighborhoods with documented crime trends and school quality, then validate with recent council dashboards and local council budgets. Remember: historical architecture attracts appreciation, while robust local cuisine supports year-round appeal and social cohesion.
Plan exits and contingencies before committing capital. Prioritize clarity, not hype.
Frequently Asked Questions
What Areas Deliver Best ROI Within 5 Years?
Within five years, you’ll see strong ROI in mixed-use sectors and growth corridors, driven by Property management efficiency and Local legislation clarity, but monitor vacancy risk, capex needs, and regional policy shifts to stay ahead.
Which Neighborhoods Balance Rental Demand and Safety?
You should choose neighborhoods balancing rental demand and safety: look for strong community amenities and solid transport connectivity, backed by data on crime and occupancy, plus vacancy trends, to minimize risk and maximize stable cash flow.
How Do University Terms Affect Yields Locally?
Do university terms affect yields locally? Yes—student housing demand surges during terms, but you’ll skew yields by timing and tenancy duration. You weigh Local amenities and student cohorts, balancing risk with data on occupancy, rents, and seasonal vacancies.
What Are Hidden Costs in Nottingham Property?
Hidden costs in Nottingham property include property tax and maintenance expenses you’ll incur. You should budget for stamp duties, insurance, and service charges, plus potential vacancy risks; data shows maintenance often exceeds initial projections, impacting net yields.
Where to Find Up-And-Coming Growth Pockets Soon?
You’ll find up-and-coming growth pockets where historic architecture thrives and green space development accelerates, supported by data on demand, vacancy decline, and rental yields, with risk assessments highlighting absorption timelines and infrastructure commitments to guide prudent investments.
Conclusion
Nottingham’s potential shines like a well-mapped skyline: steady yields in Wollaton and Beeston, university corridor demand humming, and city-center rents stabilizing even when markets wobble. Picture regeneration as fresh fascia on historic bricks, transit lines threading neighborhoods, and green spaces punctuating daily commutes. You’ll balance risk with diverse micro-markets, leverage active financing signals, and stay nimble as growth indicators shift. In short, invest smartly, live well, and watch Nottingham’s mosaic pay steady dividends.